How to Spot a Bear Market Bottom and Avoid Missed Opportunities
 Oct, 29 2024
Bear Market Bottom Checker
Check indicators to see if the market may be approaching a bottom.
Key Takeaways
- Bear market bottoms usually follow a 20%+ drop and show convergence of several fundamental, technical and sentiment signals.
- Recessionary bears are deeper (≈‑35% median) and last longer (≈18 months) than non‑recessionary bears (≈‑22% median, 3 months).
- Watch corporate earnings turning positive, yield‑curve normalization, inventory depletion, and a spike in capitulation volume.
- Extreme pessimism and contrarian sentiment often line up with the true bottom.
- Use a multi‑factor checklist; no single metric can time the bottom perfectly.
When markets have been falling for months, investors scramble to figure out whether the worst is finally over. Spotting the bear market bottom isn’t a crystal‑ball exercise - it’s about stitching together clues from the economy, company results, investor mood and price action. Below you’ll get a step‑by‑step guide, real‑world data, and a handy checklist to help you see the inflection point before the next rally kicks in.
What Exactly Is a Bear Market Bottom?
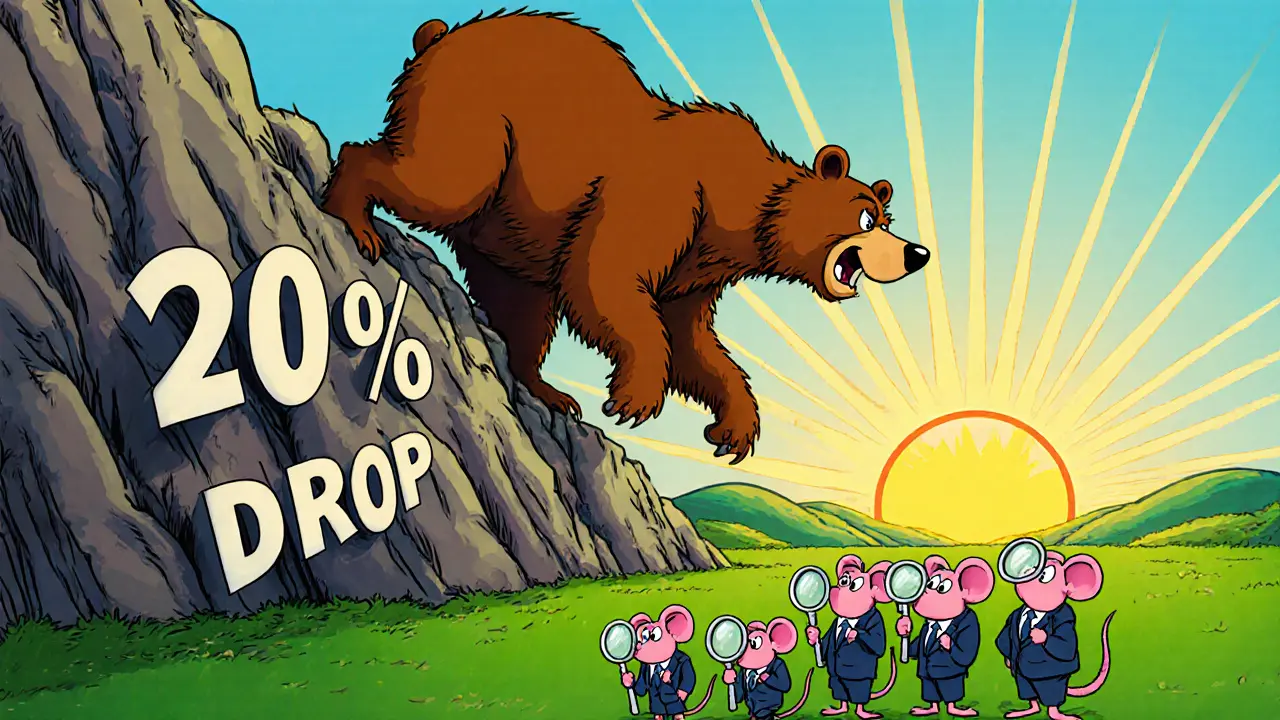
Bear Market Bottom is the point in a bear market where stock prices stop falling and start a sustained upward trend. Historically, analysts define a bear market as a decline of at least 20% from recent highs; the bottom is the lowest price level before a recovery that lasts for several months or more. It’s the market’s “floor” - not a single day, but a period where multiple indicators start to turn positive.
How Deep and How Long? Recessionary vs. Non‑Recessionary Bears
Not all bear markets are created equal. Research on 15 bear markets since 1950 shows two clear families:
| Metric | Recessionary Bear | Non‑Recessionary Bear |
|---|---|---|
| Median drawdown | ‑35% | ‑22% |
| Average duration | ≈ 18 months | ≈ 3 months |
| Typical trigger | Economic recession | Valuation correction, policy shift |
Why does this matter? If the broader economy is contracting, you’ll likely see a deeper, longer slide, and the bottom may take more time to form. In a non‑recessionary bear, the bottom can be sharper but shorter, often followed by a quicker bounce.
Fundamental Signals to Watch
Fundamentals give you the “why” behind price moves. Here are the most reliable clues.
Corporate Earnings Recovery
Corporate Earnings represent the net profit generated by companies. When earnings have been falling for multiple quarters and then start to rise, that trend often precedes a market bottom. Look for two consecutive quarters of earnings growth, especially in the S&P 500’s earnings per share (EPS) series. The start of earnings expansion signals that profitability is returning, which encourages investors to re‑enter.
Yield Curve Normalization
Yield Curve plots interest rates of bonds across maturities. An inverted curve (short‑term rates higher than long‑term) has accompanied every recessionary bear market. When the 10‑year Treasury yield climbs back above the 2‑year rate, it often marks the approach of recovery. Keep an eye on the spread; a sustained positive spread for three months is a strong bullish sign.
Inventory Levels and Demand
Inventory Levels measure how much product manufacturers and retailers are holding. High inventories paired with weak consumer demand are hallmark bear‑market symptoms. As inventories start to shrink and demand picks up - shown by rising retail sales and factory orders - the economy is clearing the backlog, paving the way for price gains.
Monetary and Fiscal Policy Shifts
When central banks pause rate hikes or cut rates, and governments boost spending or tax relief, the combined stimulus can shorten a bear market. Look for statements from the Federal Reserve or the Reserve Bank of NewZealand indicating a shift from tightening to easing.
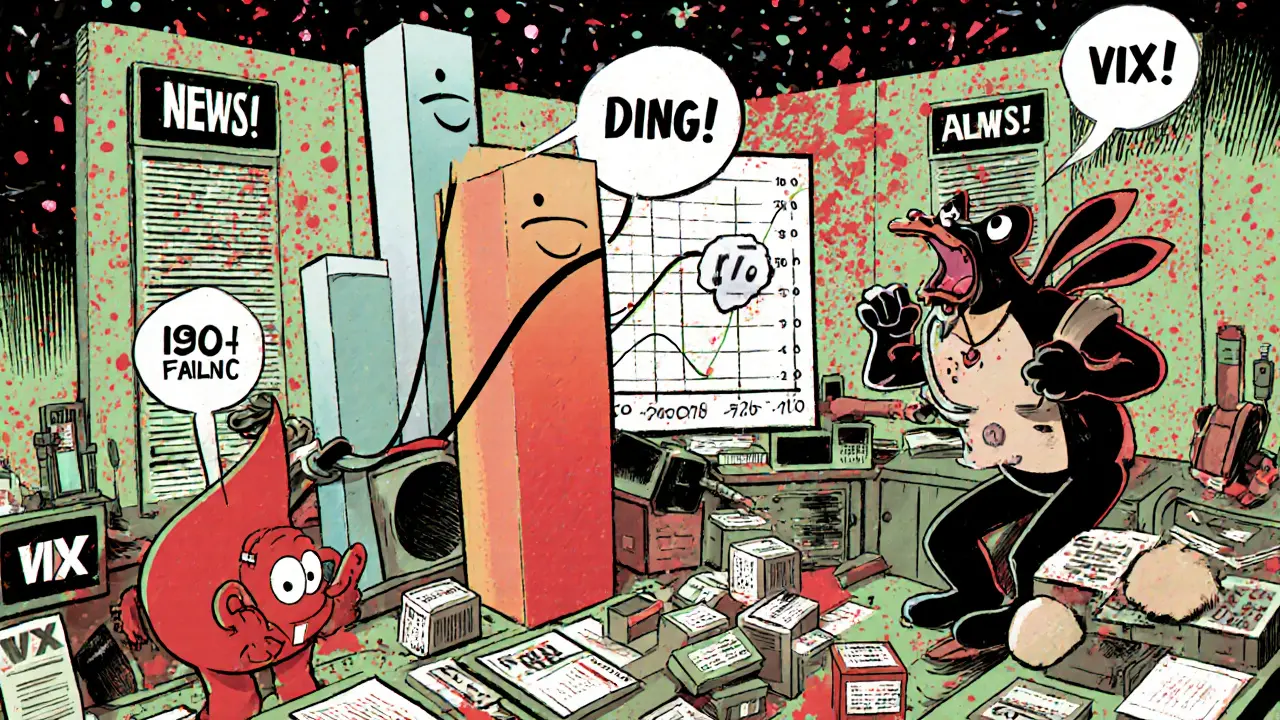
Sentiment Indicators: The Power of Pessimism
Investor mood flips from euphoria at market peaks to despair at bottoms. Two data points capture that swing:
- VIX (Fear Index) - spikes above 40 often coincide with capitulation.
- Surveys - the American Association of Individual Investors (AAII) sentiment survey showing a record low in bullish sentiment.
When sentiment reaches a trough, contrarian investors see a buying opportunity. Remember, extreme pessimism usually lines up with the true bottom.
Technical Patterns That Complement Fundamentals
Technical analysis adds a layer of timing to the broader picture. Key patterns to monitor:
- Capitulation Volume Spike: a massive surge in sell volume on the final down‑day, often followed by a sharp drop in volatility.
- Moving‑Average Crossover: the 50‑day moving average crossing above the 200‑day (the “golden cross”) can signal the start of a longer‑term uptrend.
- Breadth Indicators: when more stocks are advancing than declining (e.g., an advancing‑issues ratio above 1), market health improves.
Use these in tandem with fundamentals; a golden cross without earnings recovery is a false signal.
Valuation Metrics - Are Prices Cheap?
At a bottom, valuations often become attractive:
- Price‑to‑Earnings (P/E) ratios fall 30‑40% below their 10‑year average.
- Price‑to‑Book (P/B) can dip below 1 for many sectors.
- Dividend Yield rises as share prices collapse, sometimes exceeding 5% for large‑cap stocks.
Low valuations alone don’t guarantee a bottom, but combined with positive earnings and improving sentiment, they form a compelling entry point.

Putting It All Together - A Practical Checklist
- Confirm a ≥20% decline from the most recent 12‑month high.
- Check the macro backdrop: Is the economy in recession? Note drawdown depth and duration expectations.
- Review the last four quarters of Corporate Earnings. Look for two straight quarters of EPS growth.
- Observe the Yield Curve spread. A positive shift sustained for 60+ days is a good sign.
- Monitor Inventory Levels and retail sales; inventory declines + sales growth = recovery momentum.
- Gauge sentiment: VIX > 40, AAII bearish sentiment > 60%, and a surge in capitulation volume.
- Validate technical cues: golden cross, improving breadth, and a calm after the volume spike.
- Assess valuations: P/E, P/B, dividend yield back to historic averages or lower.
- If 5‑plus items from the list are positive, consider allocating capital gradually.
This isn’t a guarantee, but the more boxes you tick, the higher the probability you’re near the bottom.
Common Pitfalls to Avoid
- Relying on a single indicator: No metric works in isolation; you’ll get false positives.
- Chasing the dip too early: Prices can keep falling after the first hint of upside; wait for convergence.
- Ignoring the macro context: A deep recession can stretch the bottom for years; adjust expectations.
- Over‑positioning: Even at a bottom, volatility stays high. Use staggered entries.
Long‑Term Perspective
Historical data shows that investors who stay invested through bear markets typically outperform those who try to time exact bottoms. The key is to be prepared - have a plan, monitor the checklist, and be ready to act when signals line up.
Frequently Asked Questions
How long does it usually take for a bear market bottom to form?
In non‑recessionary bears the average duration is about three months, while recessionary bears average around 18 months. The exact timing varies, so watch for a convergence of indicators rather than a set calendar.
Can the VIX alone tell me when the bottom is near?
No. The VIX spikes during extreme fear, but a high VIX can persist for weeks. Combine it with earnings recovery, yield‑curve normalization and valuation improvements for a stronger signal.
Do all sectors hit the bottom at the same time?
Not usually. Defensive sectors like utilities and consumer staples often stabilize first, while cyclical sectors (industrial, tech) may lag. Look for sector‑wide earnings turn‑around before committing broadly.
Should I wait for a "golden cross" before buying?
A golden cross is a helpful technical confirmation, but it’s not required. If fundamentals are strong and sentiment is at a trough, you can start buying even before the cross appears.
What’s the best way to position my portfolio after I think the bottom is near?
Use a staggered approach: allocate a core portion to diversified index funds, add sector‑specific ETFs that showed early earnings recovery, and keep a cash reserve for any further dips. Re‑balance quarterly based on updated indicator readings.
Philip Smart
October 29, 2024 AT 13:06Looks like someone just copied a textbook checklist.
Manas Patil
November 4, 2024 AT 19:06Brilliant synthesis of macro‑fundamental and technical modalities! The checklist captures the quintessential pivot points: earnings recovery, yield‑curve normalization, and sentiment extremities. Leveraging such a multi‑factor framework aligns with modern portfolio theory's diversification tenets. By quantifying each signal, you can calibrate capital allocation with statistical rigor. Keep iterating the model; adaptive weighting will only enhance signal fidelity.
Annie McCullough
November 11, 2024 AT 01:06Y'know, i think the whole bottom thing is overhyped :) the VIX can scream forever and the market still hangs on a thread lol ;) 😏
Carol Fisher
November 17, 2024 AT 07:06🇺🇸 Our markets deserve protection from foreign meddling, not endless speculation! 📈💥
Melanie Birt
November 23, 2024 AT 13:06Great start, but let’s add a bit of nuance. First, the checklist should weight earnings recovery higher than inventory data because profit trends directly influence cash flows. Second, consider sector‑specific yield‑curve spreads; financials react differently than tech. Third, incorporate a trailing stop‑loss framework once you begin allocating – volatility can stay elevated for weeks. Finally, keep a cash buffer for unexpected macro shocks. These tweaks make the tool more robust for real‑world execution.
Lady Celeste
November 29, 2024 AT 19:06Never trust a single metric. Too easy to game.
Ethan Chambers
December 6, 2024 AT 01:06One must appreciate the sublime elegance of a well‑timed golden cross, yet the masses will never grasp its esoteric virtue. In my experience, the confluence of a tapering VIX and a resurgent P/E ratio signals a tacit invitation to the discerning few. Of course, the crowd will cling to their outdated sentiment indexes, but true investors revel in contrarian finesse. Let the herd babble; the discerning mind simply calibrates exposure.
gayle Smith
December 12, 2024 AT 07:06Listen up, folks! The checklist is just a starter pack – you need to dive deep into the balance sheet alchemy, scrutinize cash conversion cycles, and watch for insider accumulation spikes. When the macro backdrop feels like a foggy afternoon, those granular data points become your lighthouse. Remember, the market loves to punish the complacent, so keep your radar on high.
mark noopa
December 18, 2024 AT 13:06Ah, the eternal quest for the phoenix rise from the ashes of a bear market – a narrative as old as civilization itself. Let us embark on a philosophic odyssey through the labyrinth of indicators, where each corridor leads to a potential revelation. First, the 20% decline threshold is not merely a number; it is a collective psyche’s acknowledgment of the abyss. Second, the macro‑environment, a tapestry woven from recessionary threads, dictates the depth and duration of our descent. Third, earnings, the lifeblood of corporates, when resurrected for two consecutive quarters, whisper of a nascent revival. Fourth, the yield curve, that ancient barometer of future expectations, when it bends back into normalcy, signals the market’s breath returning. Fifth, inventory dynamics, those silent custodians of supply‑demand equilibrium, when they finally shed excess, herald momentum. Sixth, sentiment – the wild beast of fear – when it reaches a nadir, the market’s contrarians find fertile ground. Seventh, technical patterns, those geometric prayers etched upon price charts, the golden cross being the most sacrosanct, bestow legitimacy upon the rally. Eighth, valuations, that humble metric of price versus earnings and book, when they retreat to historic averages, tempt the rational investor. Ninth, the culmination – a synthesis of five or more signals – invites the prudent allocator to step onto the stage. Yet, dear reader, let us not be deceived by the allure of certainty. The market, a living organism, possesses a propensity for chaos, and each indicator is but a stochastic echo of that chaos. Therefore, while this checklist serves as a compass, it is the sailor’s judgment, seasoned by experience, that ultimately determines safe harbor. In the end, the dance of capitulation and resurgence continues, and we, humble observers, must remain vigilant, adaptable, and ever‑curious.
Rama Julianto
December 24, 2024 AT 19:06Excellent breakdown! I’d add that monitoring the Federal Reserve’s forward guidance can sharpen timing. Also, keep an eye on sector‑specific earnings beats – they often lead the broader index. Finally, don’t forget to preserve liquidity for sudden dips; the bottom can be jagged.
Helen Fitzgerald
December 31, 2024 AT 01:06Love the energy here! Remember, confidence builds when multiple signals line up – it’s like a team high‑five. Start with a modest position and scale in as each new box ticks. Celebrate each small win; it keeps the motivation alive as markets turn.
Jon Asher
January 6, 2025 AT 07:06I think the checklist is a solid starter, but keep it simple. Too many boxes can freeze you. Move in when you see three solid signs and stay flexible.
Scott Hall
January 12, 2025 AT 13:06Nice tool, but don’t get too attached. Markets love to surprise, so keep a cool head and enjoy the ride.
Jade Hibbert
January 18, 2025 AT 19:06Wow, another checklist – because we totally don’t have a gazillion of those already. 😂 Maybe try a crystal ball next?
Leynda Jeane Erwin
January 25, 2025 AT 01:06Dear participants, kindly note that this discussion shall remain courteous and professional.
Brandon Salemi
January 31, 2025 AT 07:06Short and sweet – good job!
Siddharth Murugesan
February 6, 2025 AT 13:06Honestly, most of these indicators are just noise. You’ll lose money if you chase them.
Hanna Regehr
February 12, 2025 AT 19:06Thanks for the comprehensive guide. I’ll keep it handy for when the market finally rebounds.